Market Review of Coconut Activated Carbon
December 2024
The global activated carbon market in 2024 continues to show signs of contraction, extending the challenges observed over the past two years. From January to July, import volumes ranged from 53,713 metric tons (MT) in July to 102,676 MT in February, reflecting a consistent downward trajectory. Import values followed a similar path, declining from USD 231.8 million in January to USD 125.7 million in July. This ongoing decline is attributed to a combination of oversupply and reduced consumption across critical applications, including water treatment and air purification.
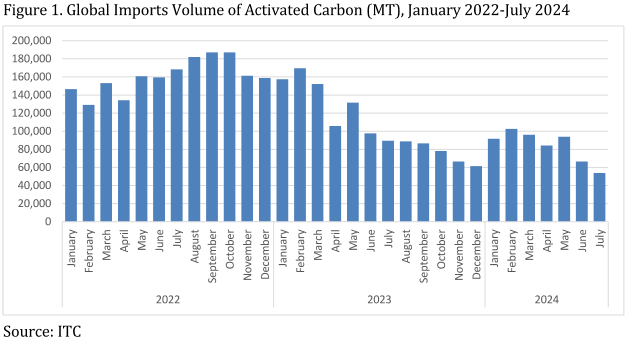
A broader perspective reveals that the market’s current state represents a stark contrast to the robust performance seen in 2022. In that year, monthly import volumes regularly exceeded 130,000 MT, peaking at 187,165 MT in September. Import values similarly reached record highs, with USD 502.7 million reported in August. By comparison, 2023 saw significant declines, with import volumes falling from 157,339 MT in January to 61,452 MT in December, and values dropping from USD 417.7 million to USD 155.7 million over the same period. The current market correction phase highlights economic uncertainties and waning industrial demand, though some stabilization is expected as supply and demand realign.
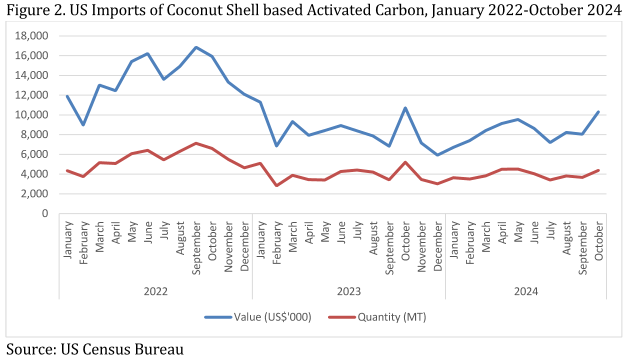
The U.S. market for coconut-shell-derived activated carbon in 2024 exhibits signs of stabilization following significant volatility in previous years. As of October, imports totaled 31,260 MT, valued at USD 65.3 million. While year-end volumes are projected to modestly decline compared to 2023, the average import price in 2024 has settled at approximately USD 2,090 per MT, down from the 2022 peak of USD 2,480 per MT. This reflects improved supply chain efficiency and greater market equilibrium. Monthly import volumes have averaged 3,126 MT, supported by consistent demand in water treatment and air purification due to stringent environmental regulations. Stable supply chains from key exporters such as India, Indonesia, the Philippines, and Sri Lanka have further contributed to this recovery.
India’s performance in the activated carbon market has been particularly noteworthy in 2024. Export volumes rose by 10.7%, from 106,051 MT in 2023 to 117,368 MT in 2024, while export values surged by 22.5%, from USD 184.3 million to USD 225.7 million. This growth reflects expanding global demand in sectors such as air purification, water treatment, and pharmaceuticals. Key markets like the United States and South Africa reported significant growth, with export values increasing by 36% and 81%, respectively. However, minimal growth in markets like Armenia and Cambodia suggests saturation or reduced demand. India’s competitive pricing and robust production capacity underscore its growing prominence in the global market, although further diversification of export destinations remains crucial for sustained growth.
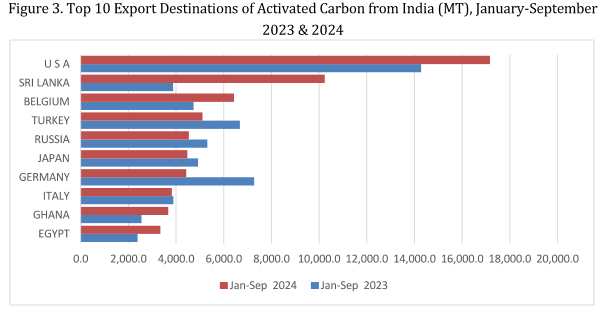
Source: Ministry of Commerce and Industry, India
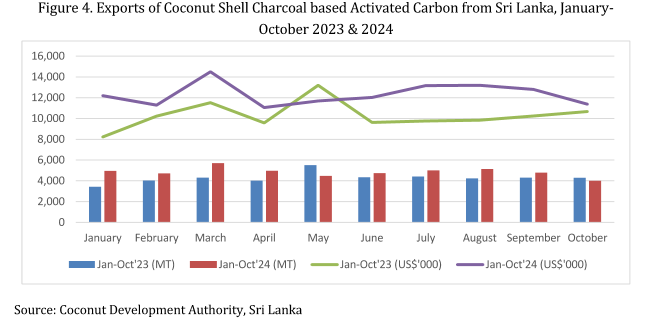
Sri Lanka’s coconut-shell-based activated carbon exports also demonstrated strong performance in 2024. From January to October, export volumes increased by 13%, from 42,941 MT in 2023 to 48,547 MT, while export values rose by 20%, from USD 102.9 million to USD 123.3 million. Monthly data highlighted significant growth, particularly in January, which saw a 44% increase in volume and a 48% rise in value. Although occasional declines, such as a 7% drop in October, were observed, the overall trend underscores Sri Lanka’s enhanced competitiveness and market presence.
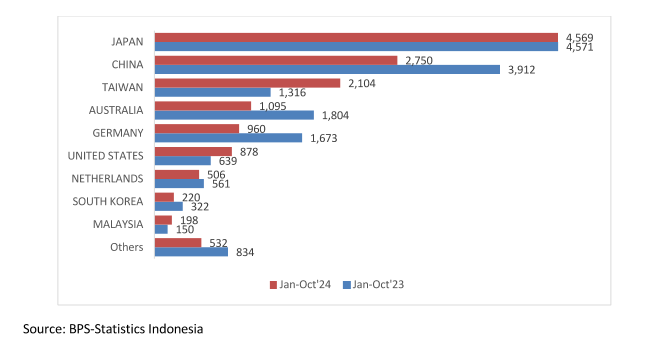
Conversely, the Philippines and Indonesia faced notable challenges in 2024. Philippine exports declined by 12.5% in volume, reaching 31,908 MT, with revenues dropping by 14% to USD 63 million between January and July. Similarly, Indonesia’s exports decreased by 12.5% in volume and 21.2% in value during the first ten months of the year. Significant declines in key markets such as China and Australia indicate supply shortages and softening global demand. However, resilience in markets like Taiwan and the United States, along with entry into new markets including Finland, Egypt, and Bangladesh, provides potential avenues for diversification.
Figure 5. Export Destinations of Activated Carbon from Indonesia (MT), January-October 2023 & 2024
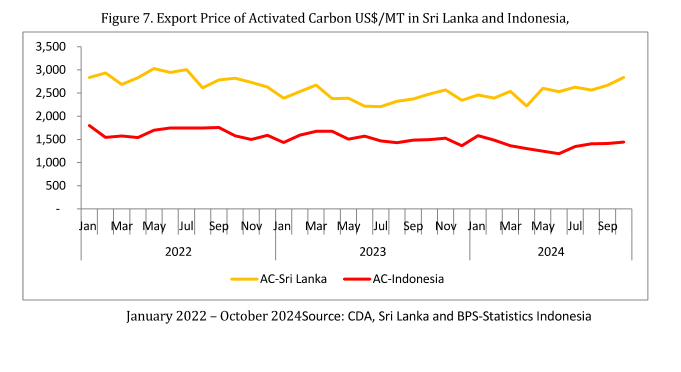
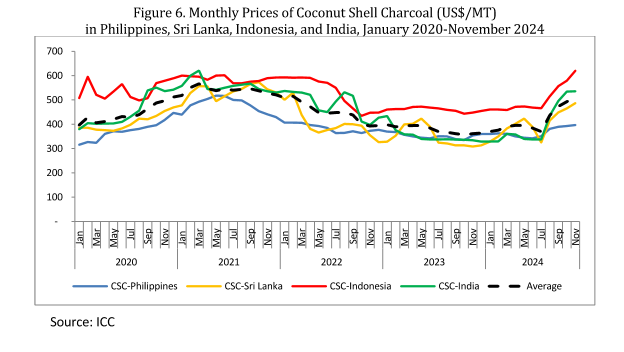
Pricing trends of coconut shell charcoal across major producing countries reflected tightening supply and recovering demand in 2024. Indonesia experienced the most significant price increase, from USD 461 per MT in January to USD 620 per MT in November. India followed, with prices rising from USD 329 to USD 536 per MT over the same period. Sri Lanka and the Philippines also recorded steady price increases. Notably, Sri Lanka’s activated carbon prices rebounded sharply, reaching USD 2,839 per MT in October, compared to USD 2,481 in the same month of the previous year. Indonesia’s subdued pricing, however, signals weaker demand.
The outlook for the activated carbon market remains varied across regions. Sri Lanka’s steady recovery points to continued growth in 2025, contingent on favorable global conditions. In contrast, Indonesia’s subdued prices highlight the need for cost optimization and quality improvements. Monitoring global trade flows and industrial demand will be crucial for shaping future strategies and ensuring sustainable growth in the activated carbon industry.