Market Review of Coconut Oil
January 2025
The coconut oil market experienced significant developments in 2024, driven by shifts in trade volumes, price dynamics, and demand patterns across key global markets. Export and import data, alongside price trends, reveal the interplay of supply constraints, growing demand, and evolving market conditions that shaped the year.
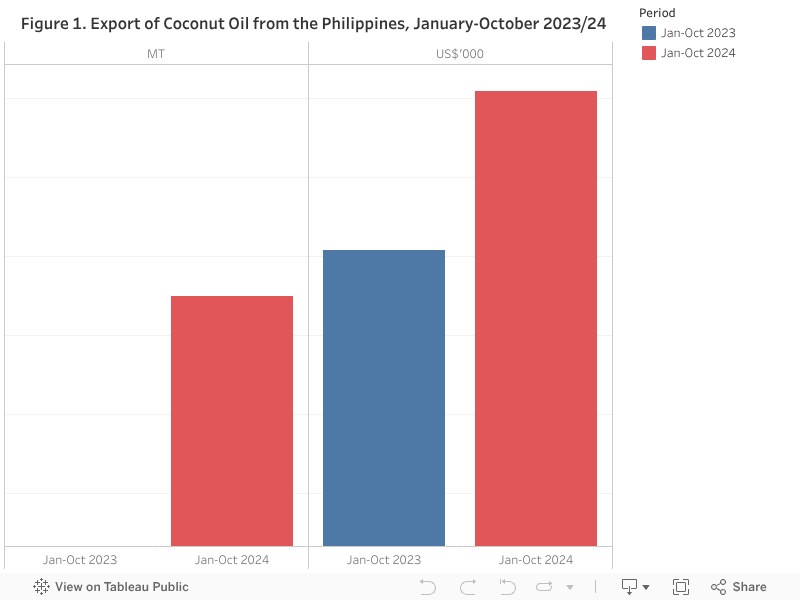
Globally, the export landscape for coconut oil (CNO) exhibited mixed trends. The Philippines, a major player in the CNO market, showcased remarkable growth in export performance. From January to October 2024, the country exported 1.35 million MT of CNO, representing a 31.3% increase compared to the same period in 2023, when exports were at 926,538 MT. In value terms, exports rose by 12.5%, from $1.41 billion to $1.61 billion. This growth underscores the ability of the Philippines to capitalize on robust global demand and maintain its competitiveness in the CNO market.
Meanwhile, Indonesia, another major exporter, witnessed a 9.0% decline in CNO export volumes during January-November 2024 compared to the same period in 2023, dropping from 663,644 MT to 603,705 MT. Despite this decline, export values increased significantly by 16.5%, reflecting the impact of higher global prices. Palm kernel oil (PKO), another key lauric oil, saw a marginal 0.5% reduction in export volumes but achieved a 17.7% increase in export value, underscoring the broader value-driven trend in lauric oil markets.
Table 1. Exports of Lauric Oils from Indonesia
| Jan-Nov 2023 | Jan-Nov 2024 | Change (%) | ||
| CNO | Volume (MT) | 663,644 | 603,705 | -9.0 |
| Value (USD'000) | 664,216 | 773,543 | 16.5 | |
| PKO | Volume (MT) | 1,238,677 | 1,233,026 | -0.5 |
| Value (USD'000) | 1,177,410 | 1,386,205 | 17.7 | |
| Lauric Oils | Volume (MT) | 1,902,320 | 1,836,731 | -3.4 |
| Value (USD'000) | 1,841,626 | 2,159,748 | 17.3 | |
Source: BPS-Statistics Indonesia
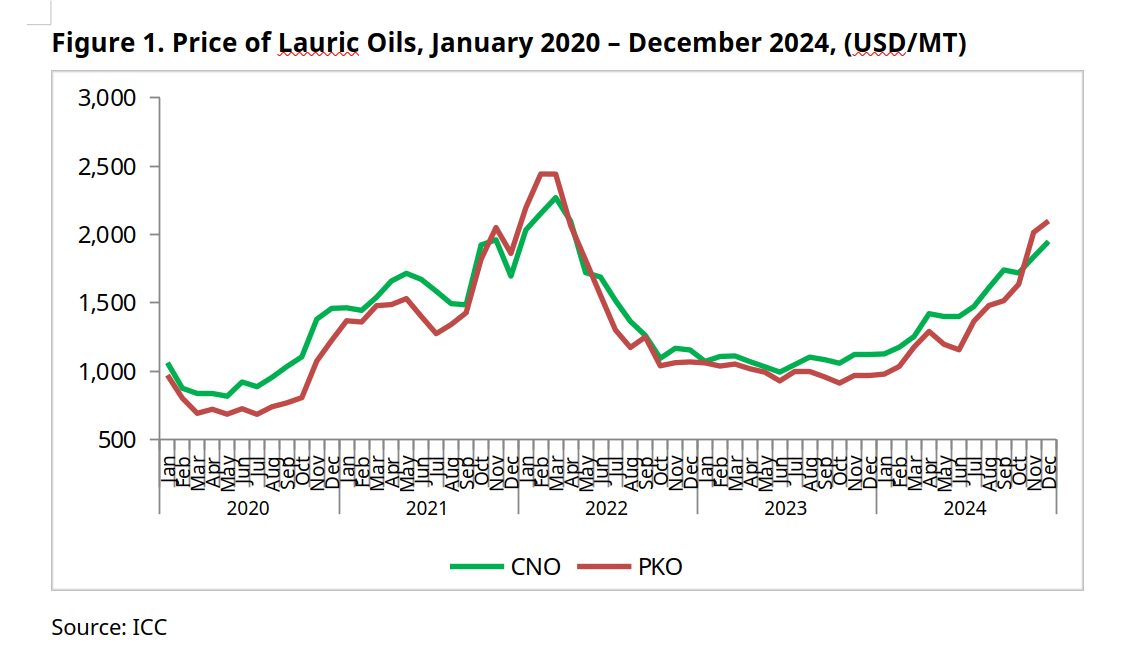
The price dynamics of CNO and PKO were particularly noteworthy in 2024. CNO prices began the year at $1,126 per metric ton (MT) and rose sharply to $1,949 per MT by December, marking a 73% increase. PKO followed a similar trend, climbing from $978 per MT in January to $2,099 per MT in December, a remarkable 115% increase. This price surge was most pronounced in the second half of the year, driven by tight supplies, strong demand, and the broader influence of biofuel mandates in key markets.
One of the standout developments in 2024 was the inversion of the historical price relationship between CNO and PKO. Traditionally, CNO has commanded a premium due to its high value in food and cosmetic applications. However, by November 2024, PKO surpassed CNO in price, reflecting its growing importance in biofuel and industrial applications. This shift highlights evolving market dynamics where industrial demand is increasingly shaping price trends.
Import demand in key markets provided further support for CNO prices. In the European Union (EU28), CNO import volumes increased by 1.5% during January-September 2024, accompanied by a 6.2% rise in import values. In contrast, PKO imports into the EU28 declined by 3.2% in volume and 5.9% in value, underscoring the variability in market preferences. In the United States, the CNO market saw robust growth, with imports rising by 19.1% in volume and 29.3% in value during January-October 2024, driven by strong demand for premium and sustainable oils.
Table 2. European Union (EU28) Imports of Lauric Oils
| Jan-Sep 2023 | Jan-Sep 2024 | Change (%) | ||
| CNO | Volume (MT) | 780,689 | 792,420 | 1.5 |
| Value (USD'000) | 1,097,160 | 1,165,598 | 6.2 | |
| PKO | Volume (MT) | 599,856 | 580,611 | -3.2 |
| Value (USD'000) | 842,253 | 792,944 | -5.9 | |
| Lauric Oils | Volume (MT) | 1,380,545 | 1,373,031 | -0.5 |
| Value (USD'000) | 1,939,413 | 1,958,542 | 1.0 | |
Source: ITC
Table 3. US Imports of Lauric Oils
| Jan-Oct 2023 |
Jan-Oct 2024 | Change (%) | ||
| CNO | Volume (MT) | 345,471 | 411,536 | 19.1 |
| Value (USD'000) | 467,774 | 604,764 | 29.3 | |
| PKO | Volume (MT) | 275,207 | 303,306 | 10.2 |
| Value (USD'000) | 374,561 | 363,351 | -3.0 | |
| Lauric Oils | Volume (MT) | 620,678 | 714,843 | 15.2 |
| Value (USD'000) | 842,335 | 968,115 | 14.9 | |
Source: The U.S. Census Bureau, Economic Indicators Division
Looking ahead, the price outlook for the next six months suggests some moderation in the upward trajectory, though prices are expected to remain elevated. Seasonal production increases in key exporting countries, coupled with favorable weather conditions, may ease supply constraints. For CNO, prices are projected to stabilize within the range of $1,750–$1,900 per MT by mid-2025, reflecting a balance between steady demand and improved supply. PKO, on the other hand, is likely to remain volatile, trading in the range of $1,900–$2,100 per MT, supported by sustained interest from biofuel and industrial sectors.
Risks to this outlook include potential weather disruptions in producing regions, policy changes impacting biofuel mandates, and shifts in global economic conditions. Conversely, a faster recovery in production or weaker-than-expected demand could temper price growth.
In conclusion, the coconut oil market in 2024 demonstrated resilience amid tight supplies and growing global demand. Despite challenges, higher prices drove strong revenue growth for exporters, even as volumes declined. The evolving dynamics between CNO and PKO, coupled with the sustained emphasis on sustainability and quality, position the coconut oil industry for continued relevance in the global edible oil and biofuel landscape. As market conditions stabilize, stakeholders will need to adapt to emerging trends and maintain a strategic focus on value-driven opportunities.